Error Tracking
Stellate Error Tracking provides a system for capturing and analyzing errors within GraphQL queries. It focuses on delivering detailed information about error paths and error codes, which is essential for identifying issues and optimizing the user interface. Unlike traditional error handling that relies on HTTP error codes, GraphQL errors are managed differently, and Stellate Error Tracking is designed to address these unique challenges.
Improved GraphQL Error Experience
The Stellate Dashboard Errors page enhances error visibility by grouping errors by Error Code, providing insights into error volume over a selected time frame. This grouping helps in quickly providing context for your errors. The Error Tracking features include:
- Stellate Error Aggregation: Error codes and error aggregation are supported to quickly provide context for errors.
- Aggregation Error Page: The Stellate Dashboard Errors page groups errors by error code, showing the operation triggering the error and the error path. The Error page offers a clear representation of errors, enabling better understanding and management of errors.
- Error Event Details: Each aggregated error allows for a detailed view of the individual error events, including the state and specific error message. This provide immediate context on the impact of errors, aiding in understanding the severity and scale of the issue.
Before You Begin
Before using Stellate Error Tracking, ensure that error paths and error codes are properly configured within your GraphQL schema. Familiarize yourself with the GraphQLError structure and how to interpret error messages for effective error tracking and management. To learn how to add an error code, read the Add Error Codes section later in this topic.
Track Errors in the Dashboard
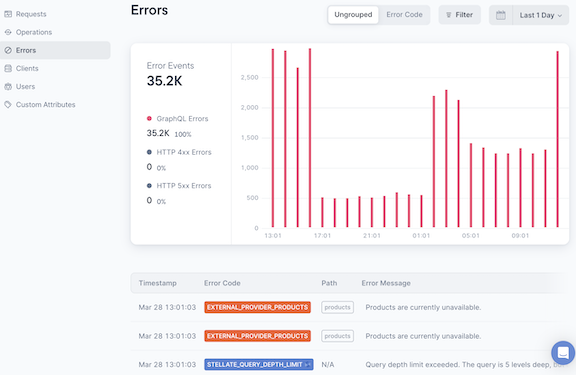
The Stellate Errors page provides a graph of Error Events and the list of errors below the graph. It allows you to view errors grouped by error code, the default view, or ungrouped errors listed by timestamp. In addition, you can select the time frame for viewing your errors and view errors by selecting Filer to select different categories of errors such as Scope, Cache State, Device and many others.
You can begin your error analysis, when you become aware of an error through the Stellate Dashboard or an error notification, such as an email alert. Once alerted, you can walk through the error analysis process to analyze the query output and error details:
- Navigate to your Stellate Services and select the Service you want to work with.
- Click on Errors in the left sidebar.
- View the Error Events panel to see the error graph, error statistics and aggregated errors by error code.
- Click on any one of the Error Code, Path, Error Event, Impact or Last Seen columns to see the first detail panel Analyze the query output and error details to identify the impact of the error by user and client version. You can also see the Full Query and Timestamps.
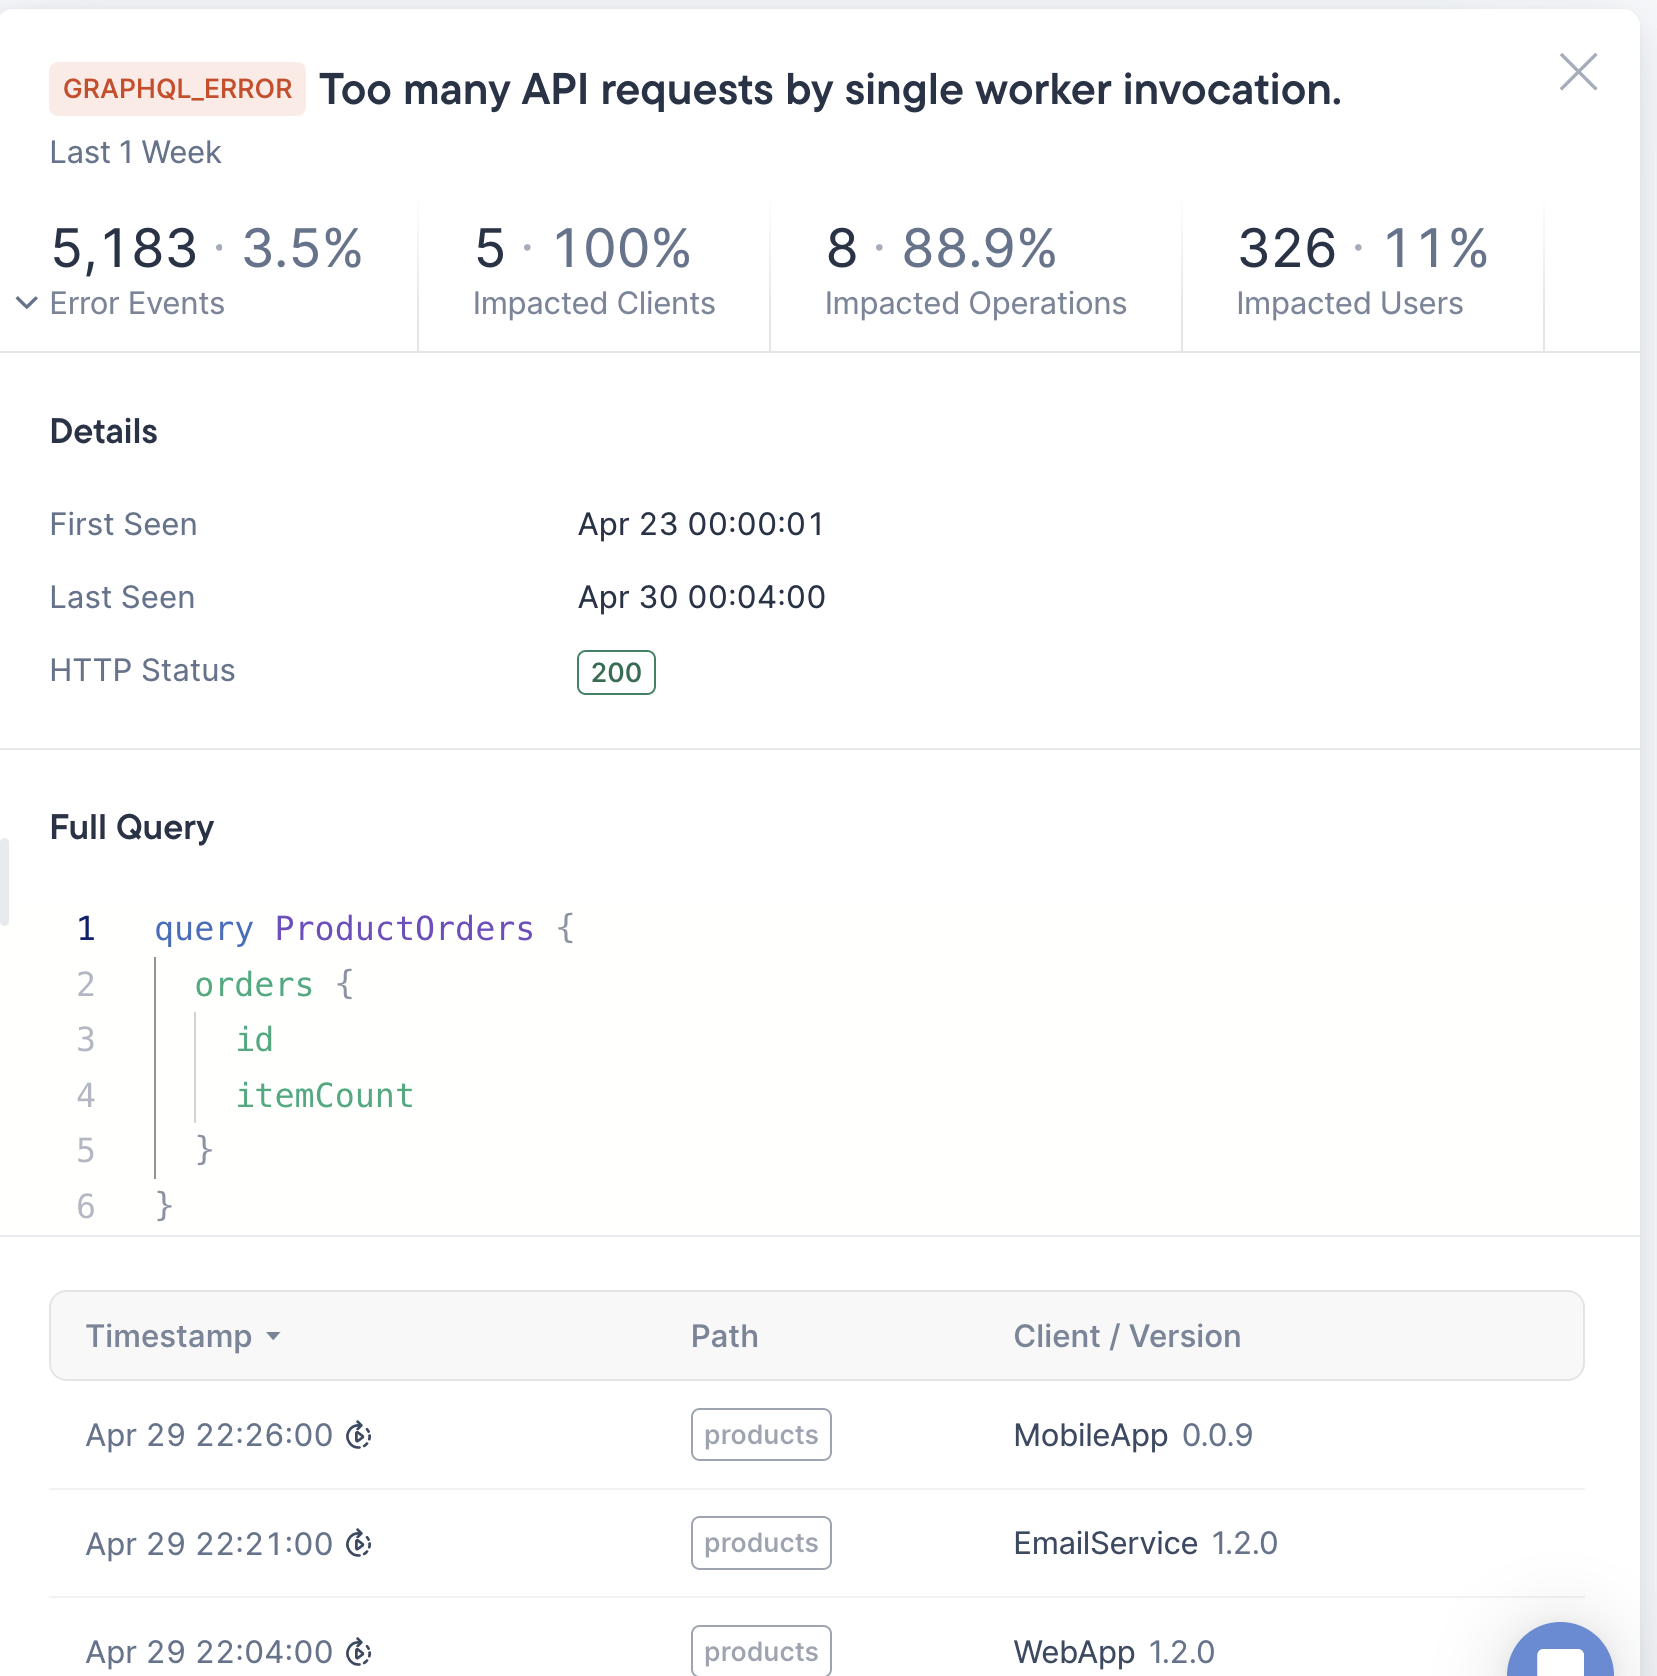
- Click on any one of the Error Code, Path, Error Event, Impact or Last Seen columns to see the first detail panel Analyze the query output and error details to identify the impact of the error by user and client version. You can also see the Full Query and Timestamps.
Ungroup Errors
The Stellate Dashboard Errors page automatically defaults to grouping errors by Error Code and shows the operation that triggered the error and the error path. You can switch from the Error Code grouped view to the Ungrouped view of errors. When this option is selected, the panel shows a list of unaggregated errors listed by Timestamp.
Add Error Codes
Error Tracking starts, when you become aware of an error and find the error using the Stellate Dashboard, either through search or by clicking your error email link. The process works as follows:
- You view the Error Event page to see the error query.
- You can see the output of the query and analyze the results to identify details about your error for easier debugging.
- In the following example, when you query the error it shows the
simulated errormessage with the associated pathproducts. However, the query is missing the code:
{
  "data": null,
	"errors": [{
		"message": "Simulated error",
		"locations": [{
			"line": 2,
			"column": 3
		}],
		"path": [
			"products"
		],
		"extensions": {
			"code": "SIMULATED_ERROR"
		}
	}]
}
- You can extend your GraphQL query to add your own error codes. The following code shows an example of how to add an error code and message to your GraphQL errors:
import { GraphQLError } from 'graphql';

throw new GraphQLError('simulated error', {
  extensions: {
    code: 'SIMULATED_ERROR',
  }
});
In our code example the message is “simulated error”. Once you introduce the extension code, the Error Event page and aggregated errors can dispaly the extensions code. In our example the error display shows SIMULATED ERROR. This is by default included on the GraphQL error.
Error Terms
- Error: the This term refers to a “rolled-up” error; a set of related error events
- Error Events: This term refers to individual error occurrences. An individual error has 1..n events.
- ErrorResponse object: contains key information such as: the operations that have errors, the response execution details, an array of errors from the GraphQL endpoint, and any network errors encountered during execution.