Get Started with GraphQL Metrics
When you use the Stellate UI to collect GraphQL Metrics, you can assess the impact of Stellate Edge Caching on performance and potential cost savings in infrastructure. You can view these metrics prior to implementing Stellate Edge Caching to analyze the production requests of your GraphQL API. This analysis will help determine whether Stellate GraphQL Edge Caching can be advantageous for your needs.
The following figure illustrates how Metrics Request Logging fits into your overall GraphQL environment.
Figure 1: Using Metrics Request Logging in the GraphQL environment.


Enable metrics
Our GraphQL Metrics have been designed for ease of implementation. To make the adoption even smoother, we provide a generic Javascript/Typescript example using fetch and Metrics Plugins for Apollo Server, GraphQL Yoga, GraphQL Mesh, and GraphQL Envelop. Use the following instructions to get started.
Before you begin
Before you can view your metrics, you need to have the following in place:
- A Stellate.co account and login.
- A GraphQL server and client setup. Using our Metrics Logging metrics in your production environment gives you the most accurate data, however, you can also start off using Metrics Logging in a staging or test environment.
- An endpoint for your service.
Create a Service to get metrics
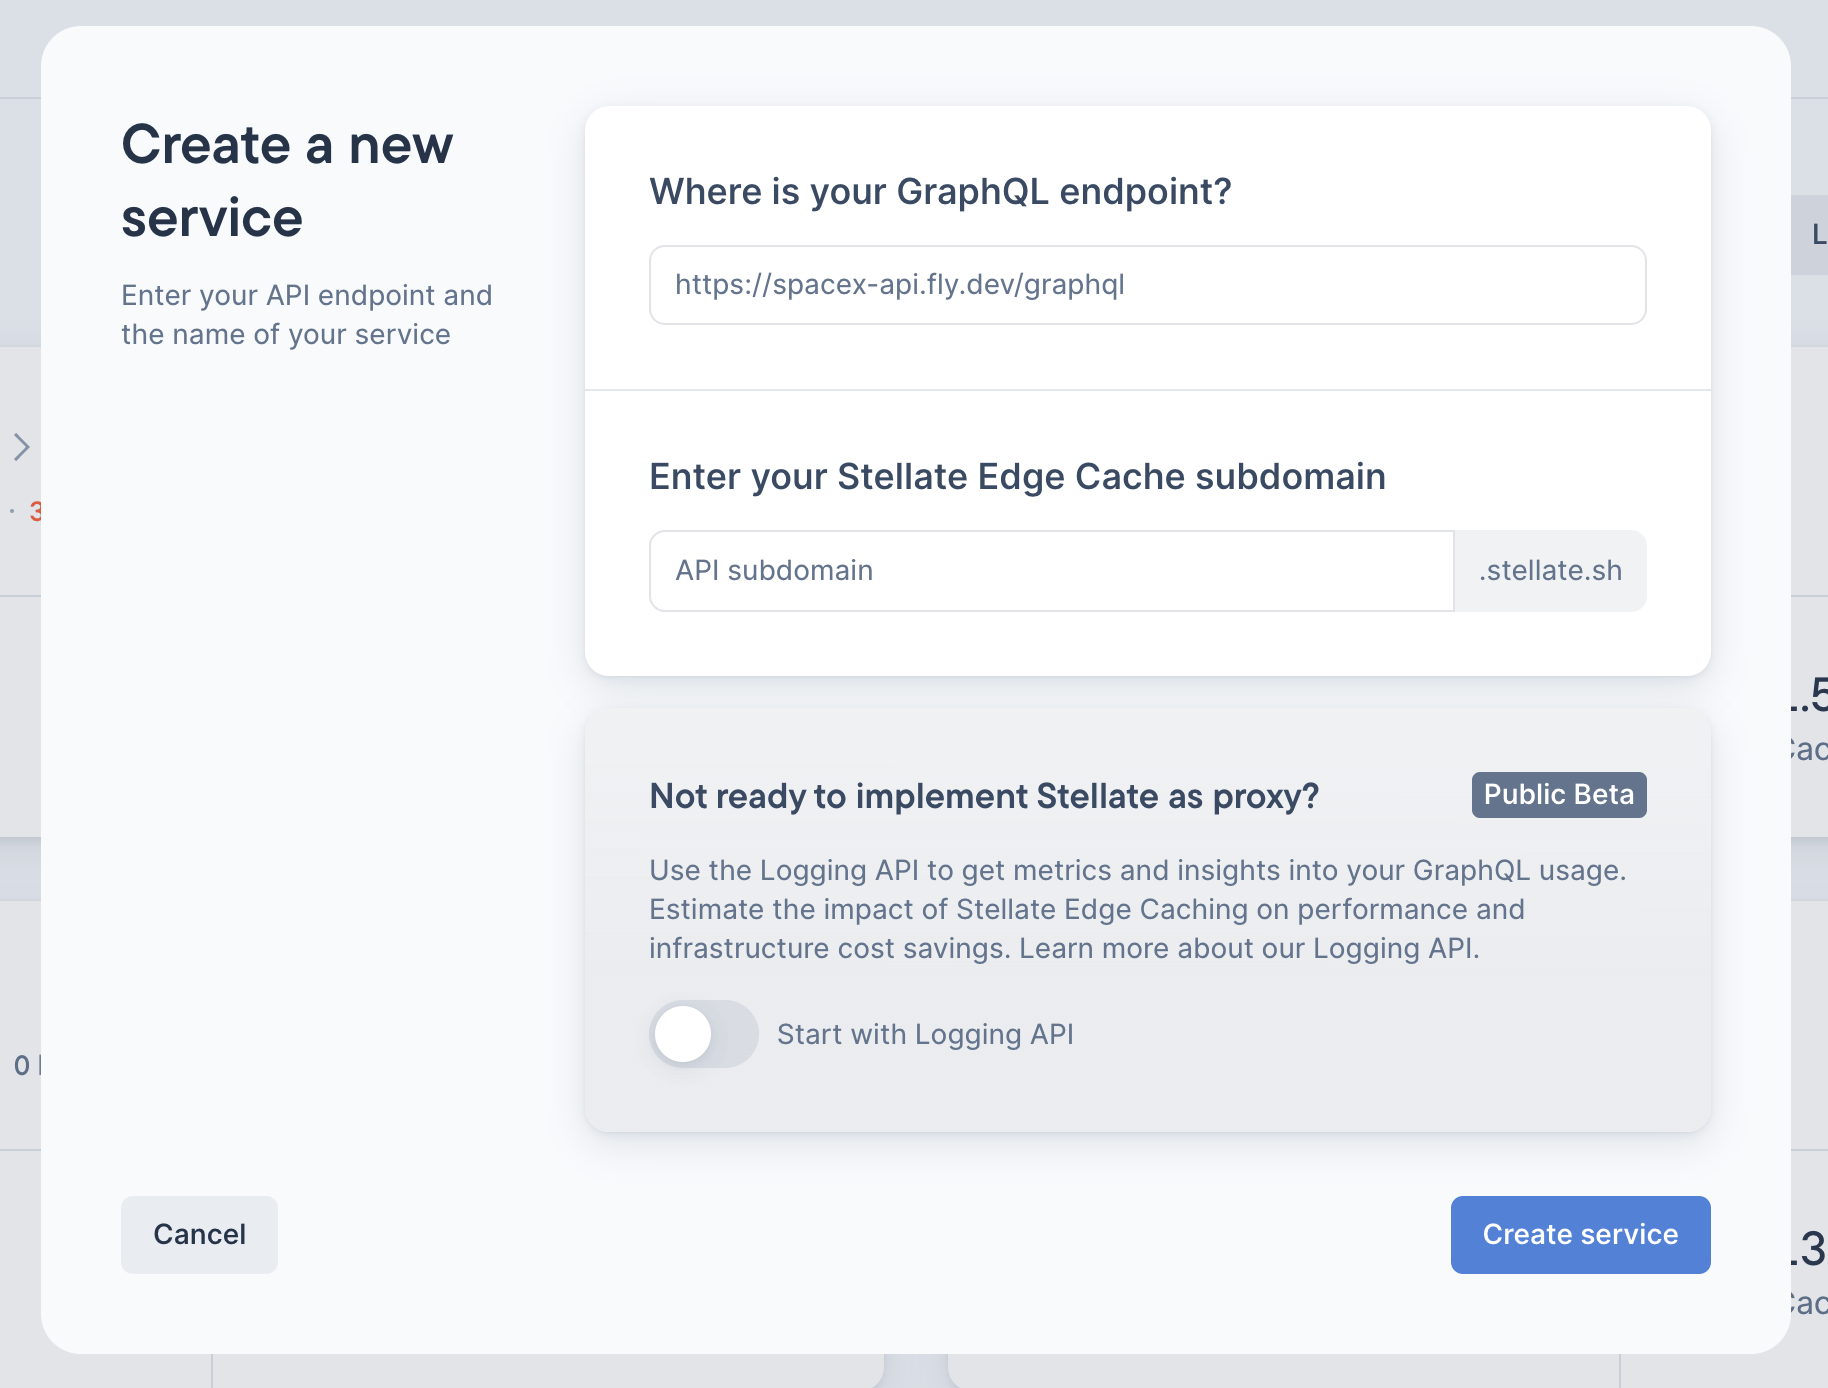
To get started, login to your Stellate account. Once you login, click the button in the upper left that lists your organization name and perform the following steps:
- Navigate to Services > Create a New Service.
- Enter your endpoint in the field under Where is your GraphQL endpoint?
- Pick a subdomain name and enter the name in the field under Enter your Stellate Edge Cache subdomain.
- Go to the heading Not Ready to implement Stellate as a proxy? Click Start with Logging API.
- Click Create service.
Validate your new service
Once you create your service, you can see information about your service in the upper left corner of your Stellate UI. Check for your Service URL and note the Guide links to the documentation beneath it. Your default account display is set to show the Metrics tab information.
Metrics collection
You have some options for pushing usage data to Stellate so that you can view metrics and insights. You can use one of the following in-product options:
- Apollo Server plugin
- GraphQL Yoga plugin
- Manual Integration with a Logging API
fetchcall
You can also push usage data by manually installing the plugin code for the Apollo Server, GraphQL Yoga, GraphQL Mesh, and GraphQL Envelop plugins. To learn more about these methods, read Metrics Plugins and Construct a Manual fetch Call.
Install the Apollo Server plugin
You can use the Apollo Server plugin to gather GraphQL metrics from your Apollo Server.
To use the Apollo Server plugin:
-
Click on the Apollo Server plugin tab.
-
Install the plugin in your Apollo Server GraphQL environment using:
npm install --save stellate -
Copy the Apollo Server fetch call, paste it into your GraphQL environment, and integrate it into your GraphQL project.
-
Execute a GraphQL operation on your server.
-
For each request, your server sends metrics from the Apollo Server plugin to the Stellate Logging API with the fetch call that you copied. By default the call contains a Stellate generated logging token, for example:
"Stellate-Logging-Token": "stl8log_0f7583bb5a5fd4ee4d08e3d99156a7cff12830c4b2bb989203fab098f11891a0”To generate your own token, refer to the section titled "Create your own logging token" later in this topic.
-
Click Continue.
Plugin integration Example: NASA Open Source
The following example from the U.S. National Aeronautics and Space Administration (NASA) demonstrates the integration of the Stellate apollo-server plugin into the NASA open-source environment. This integration allows for the collection and display of GraphQL metrics in the Stellate UI metrics dashboard.
https://github.com/nasa/cmr-graphql/pull/76/files#diff-8b07922e50f13f269c84c72d25e3d9affd0e149d2e9ea7c6fd36a06417bbbcfc
Install the GraphQL Yoga plugin
To use the GraphQL Server plugin:
-
Click on the GraphQL Yoga plugin tab.
-
Install the plugin in your GraphQL Yoga environment using:
npm install --save stellate -
Copy the GraphQL Yoga fetch call, paste it into your GraphQL environment, and integrate it into your GraphQL project. For an example see
-
Execute a GraphQL operation on your server.
-
For each request, your server sends metrics from the GraphQL Yoga plugin to the Stellate Logging API with the fetch call that you copied. By default the call contains a Stellate generated logging token, for example:
"Stellate-Logging-Token": "stl8log_8246e2ad053433a7bbe514d0b9825de50a5e57038afb1709ea75c35e28849dbf"To generate your own token, refer to the section titled "Create your own logging token" later in this topic.
-
Click Continue.
Create your own logging token
To generate your own token:
- Navigate to your service.
- Click Config > Tokens > Create a Token > Logging API.
- Click Create Token and copy the token to a secure location.
- Replace the existing token in the
fetchcall with your new one.
Get metrics manually
You can copy the boilerplate fetch call example and install it in your GraphQL server environment. You can use it as is or modify the call to specify any details you need to add about your particular environment.
Note: We also provide the detailed information you need to construct your own call from scratch. See Build a Metrics Logging Call to find out how to build your own fetch call.
To use the Stellate Logging API:
-
Click on the Logging API tab.
-
Copy the
fetchcall and install it in your environment.Note: We provide a convenient copy icon that you can click to copy the contents on the tab.
-
Execute a GraphQL operation on your server.
-
For each request, your server sends the metrics to the Stellate Logging API with the
fetchcall. By default the call contains a Stellate generated logging token, for example:"Stellate-Logging-Token": "stl8log_0f7583bb5a5fd4ee4d08e3d99156a7cff12830c4b2bb989203fab098f11891a0” -
Click Continue.
Integrate the plugin or metrics manual call
After you have installed a plugin or done a manual integration, you need to integrate the plugin or call in your GraphQL environment. To do this:
- Navigate to your Service.
- Click the Config tab.
- In the Config editor, after
config: {, insert your plugin code orfetchcall.
For an example, see the earlier section, "Plugin integration Example: NASA Open Source".
About the types of Stellate metrics
Once you have enabled your metrics, the Stellate platform offers three tabs for Metrics, Requests, and Config options and several types of metrics. You can select from several metric categories to drill down into key insights into your GraphQL API. They are located on the left-side of your display. The display defaults to the Metrics tab and Caching Insights metrics. Read About GraphQL Metrics for a summary of the metrics types.
Discover more
- About GraphQL Metrics
- Metrics Logging Plugins
- The Apollo Server Metrics Plugin topic.
- The Mesh Metrics Plugin topic.
- The Envelop Metrics Plugin topic.
- The Yoga Metrics Plugin topic.
- The Ruby Metrics Plugin topic.
- The Strawberry Metrics Plugin topic.
- Use the Edge Proxy for GraphQL Metrics
- Build a Metrics Logging Call